
ROI Calculator XLS
Excel remains the business standard. Build ROI models with spreadsheet functions and formulas.
How the ROI Calculator XLS works
Create spreadsheet-style ROI calculations. Learn formulas, build models, and export templates for your own analysis.
Spreadsheet skills differentiate professionals. This calculator teaches advanced ROI modeling techniques.
How it works
Tutorial
Spreadsheet-based ROI calculations provide dynamic financial modeling capabilities essential for professional analysis. XLS format enables scenario testing, sensitivity analysis, and presentation-ready outputs that simple calculators cannot deliver. Mastering spreadsheet ROI formulas—including understanding cell references, creating data tables, and building reusable templates—elevates your financial analysis capabilities.
You have two options: use the calculator above to generate downloadable XLS ROI templates, or follow this guide to build sophisticated spreadsheet ROI models from scratch.
The Formula
| Calculation | Spreadsheet Formula |
|---|---|
| Simple ROI | =((Revenue-Cost)/Cost)*100 |
| Cumulative Cash Flow | =SUM($B$2:B2) |
| NPV | =NPV(discount_rate,cashflows)+initial |
| IRR | =IRR(cash_flow_range) |
| Payback Period | =MATCH(TRUE,cumulative>0,0) |
Step-by-Step Calculation
Let’s build a professional XLS ROI model with advanced features.
Step 1: Create Structured Input Section
Build clearly organized input area:
| Row | Cell A | Cell B | Cell C |
|---|---|---|---|
| 1 | INVESTMENT INPUTS | ||
| 2 | Initial Investment | $150,000 | =150000 |
| 3 | Annual Revenue | $85,000 | =85000 |
| 4 | Annual Costs | $42,000 | =42000 |
| 5 | Project Years | 5 | =5 |
| 6 | Discount Rate | 10% | =0.10 |
| 7 | Annual Growth Rate | 3% | =0.03 |
Best Practice: Color-code input cells (yellow background) to distinguish from calculations.
Step 2: Build Cash Flow Projection Table
Create year-by-year financial model:
| Row | Year | Revenue | Costs | Net CF | Cumulative |
|---|---|---|---|---|---|
| 10 | 0 | $0 | $150,000 | -$150,000 | -$150,000 |
| 11 | 1 | $85,000 | $42,000 | $43,000 | -$107,000 |
| 12 | 2 | $87,550 | $43,260 | $44,290 | -$62,710 |
| 13 | 3 | $90,177 | $44,558 | $45,619 | -$17,091 |
| 14 | 4 | $92,882 | $45,895 | $46,987 | $29,896 |
| 15 | 5 | $95,668 | $47,272 | $48,396 | $78,292 |
Formula for C11 (Revenue Year 1): =$B$3
Formula for C12 (Revenue Year 2): =C11*(1+$B$7)
Formula for D12 (Costs Year 2): =D11*(1+$B$7)
Formula for E11 (Net Cash Flow): =C11-D11
Formula for F11 (Cumulative): =F10+E11
Step 3: Calculate ROI Metrics Section
Build comprehensive metrics dashboard:
| Row | Metric (Col A) | Formula (Col B) | Result |
|---|---|---|---|
| 18 | RETURN METRICS | ||
| 19 | Total Revenue | =SUM(C11:C15) | $451,277 |
| 20 | Total Costs | =D10+SUM(D11:D15) | $372,985 |
| 21 | Total Profit | =B19-B20 | $78,292 |
| 22 | Simple ROI % | =(B21/B2)*100 | 52.19% |
| 23 | Net Present Value | =NPV(B6,E11:E15)+E10 | $18,764 |
| 24 | Internal Rate of Return | =IRR(E10:E15)*100&”%” | 14.67% |
| 25 | Payback Period (years) | =MATCH(TRUE,F10:F15>0,0)/12 | 3.36 |
Calculation for ROI: =($78,292/$150,000)*100 = 52.19%
Step 4: Create Data Table for Sensitivity Analysis
Build two-variable data table to test scenarios:
| Discount Rate → | 8% | 10% | 12% | 15% | |
|---|---|---|---|---|---|
| Annual Revenue ↓ | NPV Results | ||||
| $75,000 | -$12,456 | -$18,322 | -$23,567 | -$31,088 | |
| $85,000 | $26,891 | $18,764 | $11,489 | $1,223 | |
| $95,000 | $66,238 | $55,850 | $46,545 | $33,534 | |
| $105,000 | $105,585 | $92,936 | $81,601 | $65,845 |
Setup: Data > What-If Analysis > Data Table; Row input: B6 (discount rate); Column input: B3 (revenue)
Step 5: Build Scenario Comparison
Create side-by-side scenario analysis:
| Scenario | Conservative | Base Case | Aggressive |
|---|---|---|---|
| Annual Revenue | $75,000 | $85,000 | $100,000 |
| Annual Costs | $45,000 | $42,000 | $40,000 |
| Growth Rate | 2% | 3% | 5% |
| ROI | 12.5% | 52.2% | 107.8% |
| NPV | -$18,322 | $18,764 | $89,445 |
| IRR | 7.2% | 14.7% | 24.3% |
| Payback | 4.8 years | 3.4 years | 2.2 years |
Use Scenario Manager: Data > What-If Analysis > Scenario Manager to save and switch between scenarios
Step 6: Create Visual Dashboard
Add charts for presentation:
| Chart Type | Data Range | Purpose |
|---|---|---|
| Column Chart | Annual Cash Flows (E10:E15) | Show yearly performance |
| Line Chart | Cumulative Cash Flow (F10:F15) | Visualize payback point |
| Waterfall Chart | Revenue/Cost breakdown | Show profit build-up |
| Gauge Chart | ROI % vs Target | Performance indicator |
Insert Charts: Insert > Charts > Select appropriate chart type for each metric
Step 7: Add Conditional Formatting
Highlight key performance indicators:
| Cell/Range | Condition | Format |
|---|---|---|
| ROI % (B22) | >20% | Green fill |
| ROI % (B22) | 10-20% | Yellow fill |
| ROI % (B22) | <10% | Red fill |
| NPV (B23) | >0 | Green text |
| NPV (B23) | <0 | Red text |
Apply: Home > Conditional Formatting > New Rule > Use formula
Step 8: Create Executive Summary
Build one-page summary dashboard:
| Summary Element | Value | Interpretation |
|---|---|---|
| Total Investment | $150,000 | Initial capital required |
| 5-Year ROI | 52.19% | Strong return on investment |
| NPV @ 10% | $18,764 | Positive value creation |
| IRR | 14.67% | Exceeds 10% hurdle rate |
| Payback Period | 3.4 years | Acceptable for 5-year project |
| Recommendation | APPROVE – Project meets all criteria | |
Final Answer: The XLS ROI model shows 52.19% ROI, $18,764 NPV, 14.67% IRR, with 3.4-year payback
What This Means
A comprehensive XLS model transforms static ROI calculations into dynamic decision-making tools. The 52.19% ROI and 14.67% IRR both exceed typical hurdle rates, while positive NPV confirms value creation. The sensitivity analysis reveals the investment remains viable across most scenarios, providing confidence in the decision. Spreadsheet modeling enables instant recalculation as assumptions change, making it invaluable for real-world decision-making where conditions evolve.
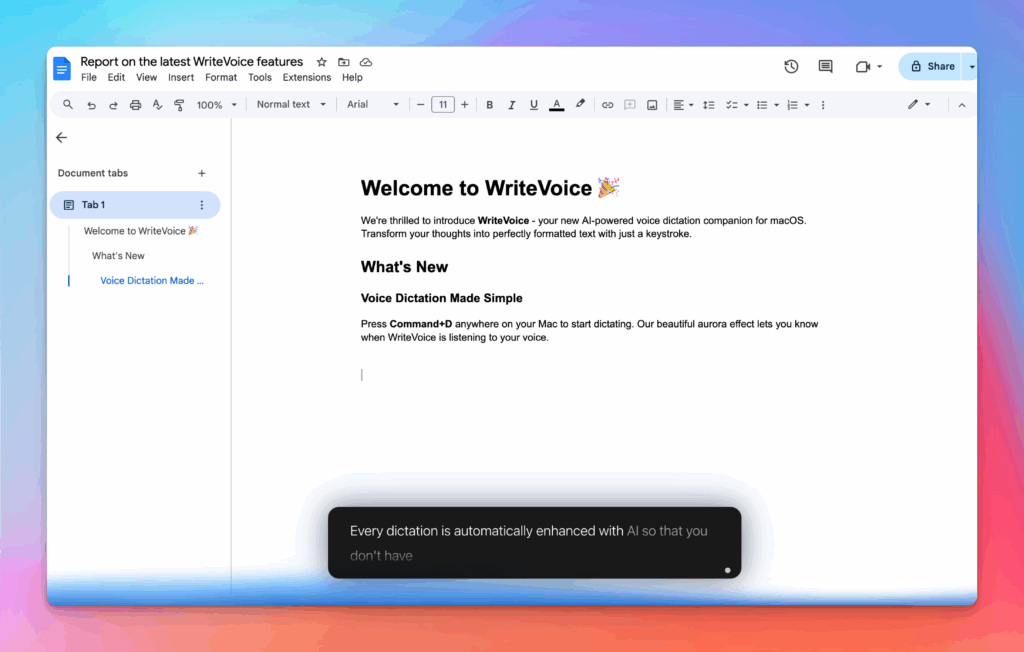
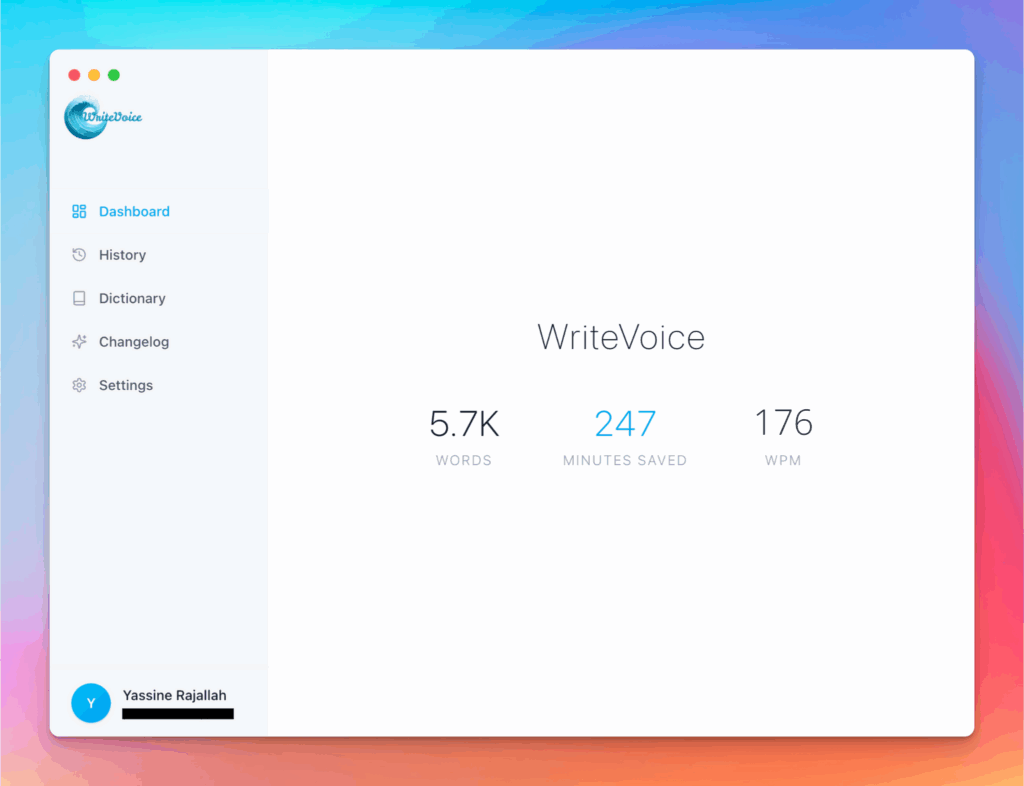
Meet the fastest voice-to-text for professionals
WriteVoice turns your voice into clean, punctuated text that works in any app. Create and ship faster without typing. Your first step was ROI Calculator XLS; your next step is instant dictation with WriteVoice.
A blazing-fast voice dictation
Press a hotkey and talk. WriteVoice inserts accurate, formatted text into any app, no context switching

Works in any app
Press one hotkey and speak; your words appear as clean, punctuated text in Slack, Gmail, Docs, Jira, Notion, and VS Code—no context switching, just speed with writevoice
Accurate, multilingual, and smart
97%+ recognition, smart punctuation, and 99+ languages so your ideas land first try, built for teams and pros.
Private by default
Zero retention, audio and text are discarded instantly, with on-device controls so you can dictate sensitive work confidently.