
ROI Calculation in Sales
Sales investments must generate revenue. Calculate returns on sales initiatives and tools.
How the ROI Calculation in Sales works
Evaluate sales investments: team expansion, CRM, training, lead generation. Calculate revenue impact and efficiency improvements.
Sales ROI directly impacts growth. This calculator quantifies returns for optimized sales investment.
How it works
Tutorial
Sales investments—whether in team expansion, CRM systems, training, or lead generation—must generate measurable revenue returns. Unlike cost-reduction initiatives, sales ROI directly impacts top-line growth, making it easier to quantify but requiring careful attribution to separate investment impact from baseline performance. Understanding how to calculate sales ROI helps prioritize investments and demonstrate the value of sales operations.
You have two options: use the calculator above to model sales initiative ROI with attribution, or follow this guide to manually calculate returns on sales investments.
The Formula
| Component | Formula |
|---|---|
| Total Sales Investment | Tools + Training + Headcount + Programs |
| Incremental Revenue | New Revenue – Baseline Growth |
| Gross Profit Impact | Incremental Revenue × Gross Margin |
| ROI Percentage | ((Gross Profit – Investment) ÷ Investment) × 100 |
Step-by-Step Calculation
Let’s calculate ROI for a sales team expansion and enablement initiative.
Step 1: Calculate Total Sales Investment
Include all costs for the sales initiative:
| Investment Category | Annual Cost |
|---|---|
| 2 Additional Sales Reps (loaded) | $180,000 |
| CRM System Upgrade | $24,000 |
| Sales Training Program | $15,000 |
| Lead Generation Tools | $36,000 |
| Sales Collateral/Content | $12,000 |
| Onboarding & Ramp Time Cost | $18,000 |
| Total Annual Investment | $285,000 |
Calculation: $180K + $24K + $15K + $36K + $12K + $18K = $285,000
Step 2: Establish Revenue Baseline
Determine what revenue would have been without investment:
| Metric | Value |
|---|---|
| Prior Year Revenue | $2,400,000 |
| Baseline Growth Rate (5%) | × 1.05 |
| Baseline Expectation | $2,520,000 |
Calculation: $2,400,000 × 1.05 = $2,520,000
Reasoning: Without investment, revenue would have grown 5% based on historical trends.
Step 3: Calculate Actual Revenue Achieved
Measure total revenue after implementing sales initiatives:
| Revenue Source | Amount |
|---|---|
| Existing Team Sales | $2,450,000 |
| New Reps Sales (partial year) | $320,000 |
| Improved Conversion (all reps) | $180,000 |
| Total Actual Revenue | $2,950,000 |
Calculation: $2,450,000 + $320,000 + $180,000 = $2,950,000
Step 4: Calculate Incremental Revenue
Isolate revenue attributable to the investment:
| Component | Amount |
|---|---|
| Actual Revenue Achieved | $2,950,000 |
| Baseline Revenue Expectation | -$2,520,000 |
| Incremental Revenue | $430,000 |
Calculation: $2,950,000 – $2,520,000 = $430,000
Step 5: Calculate Gross Profit Impact
Convert revenue to profit using company margin:
| Component | Value |
|---|---|
| Incremental Revenue | $430,000 |
| Gross Profit Margin | × 65% |
| Incremental Gross Profit | $279,500 |
Calculation: $430,000 × 0.65 = $279,500
Reasoning: Use gross profit, not revenue, for accurate ROI since COGS must be paid.
Step 6: Calculate Sales ROI
Determine return on sales investment:
| Step | Calculation | Result |
|---|---|---|
| Calculate net gain | $279,500 – $285,000 | -$5,500 |
| Divide by investment | -$5,500 ÷ $285,000 | -0.0193 |
| Convert to percentage | -0.0193 × 100 | -1.93% |
Calculation: (($279,500 – $285,000) ÷ $285,000) × 100 = -1.93%
Step 7: Analyze Year 2 Projection
Account for full rep productivity and reduced investment:
| Year 2 Projection | Amount |
|---|---|
| Baseline (prior year + 5%) | $2,646,000 |
| New Reps (full year productivity) | $640,000 |
| Continued Conversion Improvement | $200,000 |
| Total Year 2 Revenue | $3,486,000 |
| Incremental Revenue | $840,000 |
| Incremental Gross Profit (65%) | $546,000 |
| Year 2 Investment (no ramp cost) | -$267,000 |
| Year 2 Net Benefit | $279,000 |
| Year 2 ROI | 105% |
Calculation: (($546,000 – $267,000) ÷ $267,000) × 100 = 105%
Step 8: Calculate Multi-Year Total ROI
Assess cumulative return over time:
| Year | Investment | Gross Profit | Net | Cumulative |
|---|---|---|---|---|
| Year 1 | $285,000 | $279,500 | -$5,500 | -$5,500 |
| Year 2 | $267,000 | $546,000 | $279,000 | $273,500 |
| Year 3 | $267,000 | $580,000 | $313,000 | $586,500 |
| 3-Year Total | $819,000 | $1,405,500 | $586,500 | |
| 3-Year ROI | 72% | |||
Calculation: ($586,500 ÷ $819,000) × 100 = 72%
Final Answer: Year 1 ROI is -1.93% (slight loss during ramp), but improves to 105% in Year 2 and 72% cumulative over 3 years
What This Means
Negative Year 1 ROI is common for sales investments due to ramp time—reps need 6-9 months to reach full productivity. The 105% Year 2 return justifies the initial investment, and cumulative 72% ROI over 3 years demonstrates strong performance. Sales ROI requires patience and proper measurement—many companies prematurely abandon initiatives that would have delivered strong returns given adequate time.
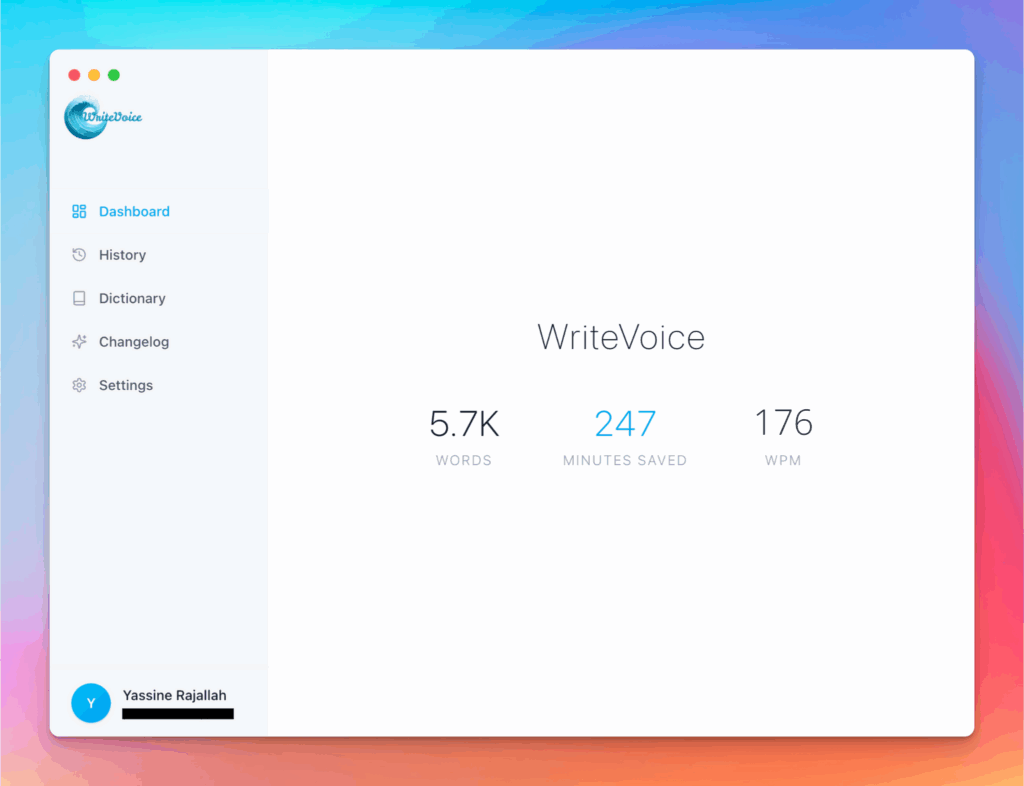
Meet the fastest voice-to-text for professionals
WriteVoice turns your voice into clean, punctuated text that works in any app. Create and ship faster without typing. Your first step was ROI Calculation in Sales; your next step is instant dictation with WriteVoice.
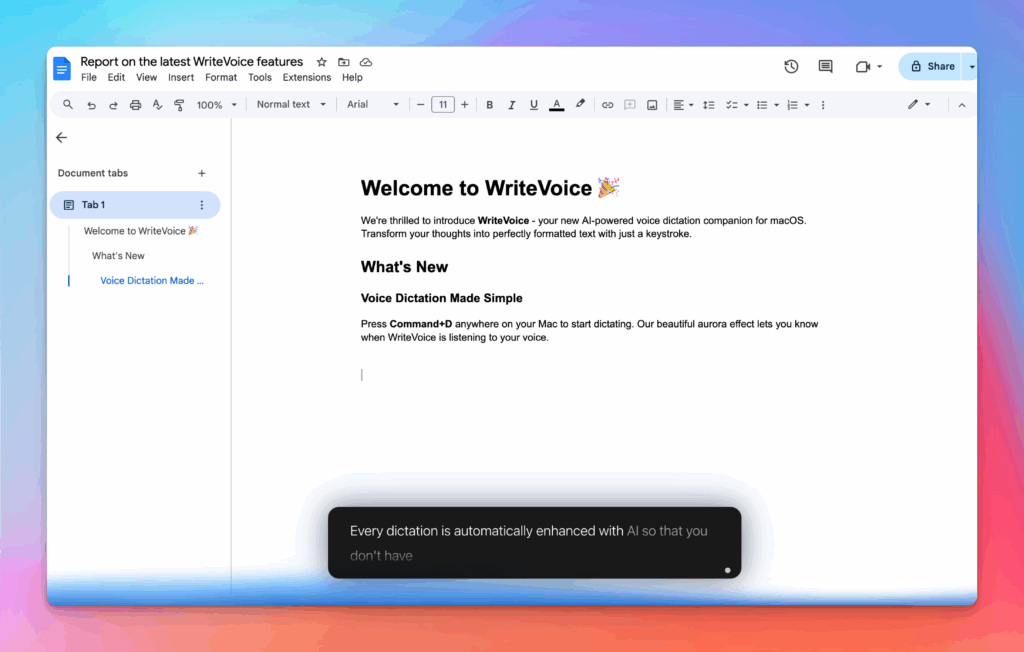
A blazing-fast voice dictation
Press a hotkey and talk. WriteVoice inserts accurate, formatted text into any app, no context switching

Works in any app
Press one hotkey and speak; your words appear as clean, punctuated text in Slack, Gmail, Docs, Jira, Notion, and VS Code—no context switching, just speed with writevoice
Accurate, multilingual, and smart
97%+ recognition, smart punctuation, and 99+ languages so your ideas land first try, built for teams and pros.
Private by default
Zero retention, audio and text are discarded instantly, with on-device controls so you can dictate sensitive work confidently.