
Investment Property ROI Calculator
Investment property success requires thorough analysis. Calculate returns with professional-grade metrics.
How the Investment Property ROI Calculator works
Evaluate properties comprehensively: cash flow, appreciation, tax benefits, leverage impact. Calculate multiple ROI metrics for informed decisions.
Property investment is complex. This calculator provides institutional-quality analysis for confident investment choices.
How it works
Tutorial
Investment property analysis requires institutional-grade calculation considering cash flow, appreciation, leverage, tax benefits, and risk—far beyond the amateur approach of “rent minus mortgage equals profit.” Professional investors calculate multiple metrics: cash-on-cash return (levered equity return), cap rate (unlevered asset performance), total return (all benefits combined), IRR (time-adjusted return), and cash flow stability. A property showing 8% cap rate but 15% total return after tax benefits and leverage might be excellent, while a 10% cap rate with negative cash flow and high vacancy risk could be terrible.
Understanding comprehensive property ROI prevents expensive mistakes. Many investors buy properties with negative cash flow hoping appreciation bails them out, only to face foreclosure when job loss eliminates the subsidy or markets stagnate. Others pass on positive cash flow properties in “boring” markets that actually deliver superior risk-adjusted returns. This calculator applies professional analysis—similar to what REITs and institutional investors use—to evaluate properties based on financial merit rather than emotion, helping build wealth through data-driven decisions.
The Basic Formula
| Metric | Formula | Interpretation |
|---|---|---|
| Cap Rate | NOI / Purchase Price | Unlevered property yield |
| Cash-on-Cash | Annual Cash Flow / Cash Invested | Levered equity return |
| Total Return | (Cash Flow + Appreciation + Principal + Tax) / Equity | Comprehensive annual return |
| 1% Rule | Monthly Rent / Purchase Price ≥ 1% | Quick screening metric |
Step-by-Step Calculation
Example: $350,000 triplex, $70,000 down (20%), $3,200 monthly rent total, $2,150 mortgage payment, $10,200 annual expenses, 4% vacancy, 3% appreciation, 28% tax bracket
Step 1: Calculate NOI and Operating Metrics
| Line Item | Calculation | Annual Amount |
|---|---|---|
| Gross Potential Rent | $3,200 × 12 | $38,400 |
| Vacancy Loss (4%) | $38,400 × 0.04 | -$1,536 |
| Effective Gross Income | $38,400 – $1,536 | $36,864 |
| Property Tax | Annual | -$4,200 |
| Insurance | Multi-unit property | -$1,800 |
| Maintenance/Repairs | 7% of gross rent | -$2,688 |
| Property Management | 8% of EGI | -$2,949 |
| Utilities (Common Areas) | Monthly average | -$900 |
| CapEx Reserve | $150/unit/month | -$5,400 |
| Total Operating Expenses | Sum | -$17,937 |
| Net Operating Income | $36,864 – $17,937 | $18,927 |
Step 2: Calculate Cash Flow and Equity Returns
| Component | Calculation | Amount |
|---|---|---|
| Net Operating Income | From Step 1 | $18,927 |
| Annual Debt Service (P&I) | $2,150 × 12 | -$25,800 |
| Annual Cash Flow | NOI – Debt Service | -$6,873 |
| Monthly Cash Flow | -$6,873 / 12 | -$573 |
| Cash Invested | Down payment + closing costs | $70,000 + $7,000 = $77,000 |
| Cash-on-Cash Return | -$6,873 / $77,000 | -8.9% |
| Cap Rate | $18,927 / $350,000 | 5.4% |
| 1% Rule Test | $3,200 / $350,000 | 0.91% (fails) |
Step 3: Calculate Total Return (All Benefits)
| Return Source | Calculation | Annual Benefit |
|---|---|---|
| Cash Flow | Negative operations | -$6,873 |
| Appreciation (3%) | $350,000 × 0.03 | $10,500 |
| Mortgage Principal Paydown | ~18% of payment year 1 | $4,644 |
| Tax Benefits (Depreciation) | ($350K/27.5 yrs) × 0.28 bracket | $3,564 |
| Tax Shield (Losses) | $6,873 loss × 0.28 | $1,924 |
| Total Annual Return | Sum of all components | $13,759 |
| Total ROI | $13,759 / $77,000 | 17.9% |
What This Means
This triplex requires $573/month out-of-pocket to own (-8.9% cash-on-cash), making it unsuitable for investors without emergency reserves or stable income. However, total return is strong at 17.9% annually when including appreciation ($10,500), mortgage paydown ($4,644), and tax benefits ($5,488). The property fails the 1% rule (0.91% vs 1.0% target), indicating it’s in an expensive, low-yield market—typical of coastal cities where investors accept negative cash flow betting on appreciation.
The 5.4% cap rate is low, suggesting either the property is overpriced or it’s in a premium location with lower risk and reliable appreciation. For investors, this property only makes sense if: 1) You have cash reserves to cover negative $6,873 annual cash flow, 2) You believe 3%+ appreciation will continue, 3) You value forced savings via mortgage paydown, and 4) You can utilize tax losses against other income. If appreciation drops to 1%, total ROI falls to 8.8%—barely better than stocks with far more concentration risk. A better deal would show positive $300-500/month cash flow even with lower appreciation, providing safety and income instead of requiring subsidy.
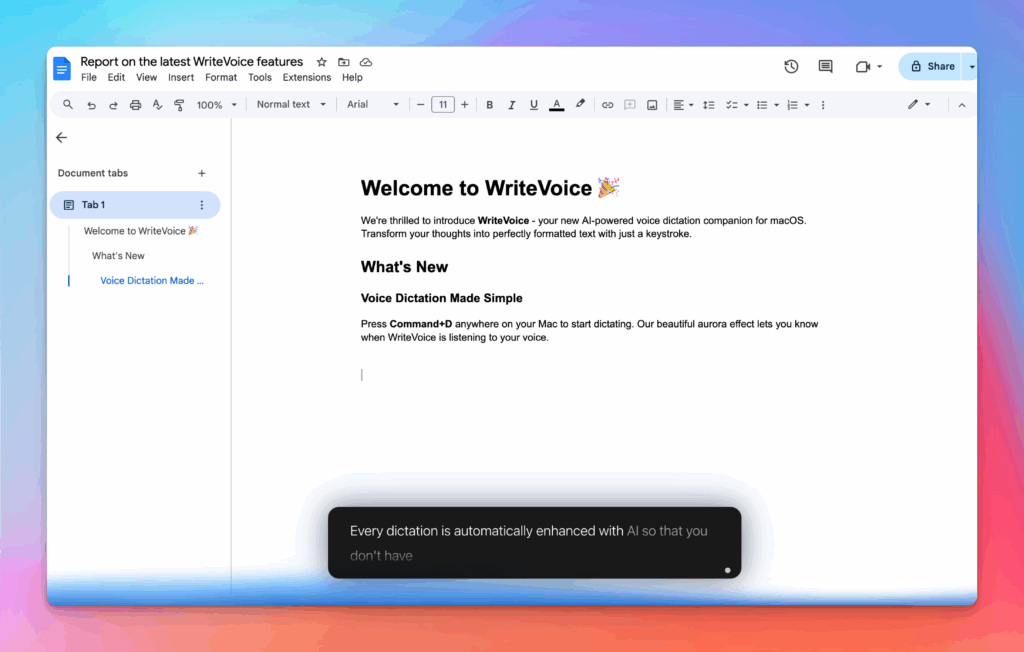
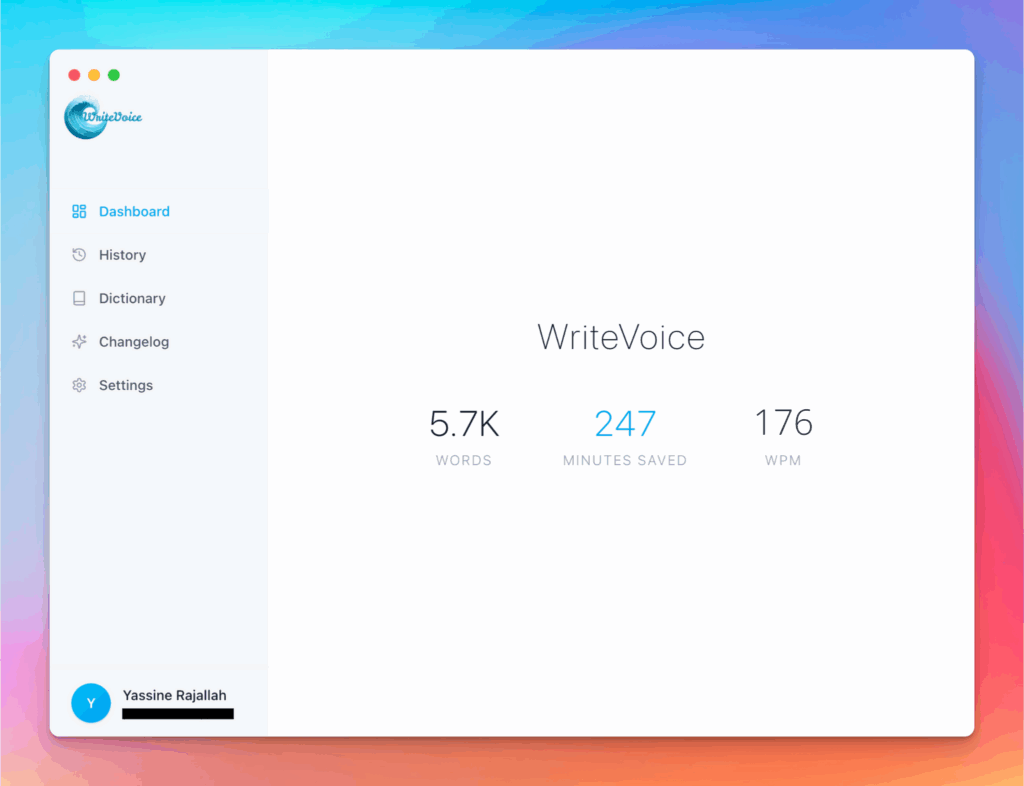
Meet the fastest voice-to-text for professionals
WriteVoice turns your voice into clean, punctuated text that works in any app. Create and ship faster without typing. Your first step was Investment Property ROI Calculator; your next step is instant dictation with WriteVoice.
A blazing-fast voice dictation
Press a hotkey and talk. WriteVoice inserts accurate, formatted text into any app, no context switching

Works in any app
Press one hotkey and speak; your words appear as clean, punctuated text in Slack, Gmail, Docs, Jira, Notion, and VS Code—no context switching, just speed with writevoice
Accurate, multilingual, and smart
97%+ recognition, smart punctuation, and 99+ languages so your ideas land first try, built for teams and pros.
Private by default
Zero retention, audio and text are discarded instantly, with on-device controls so you can dictate sensitive work confidently.