
How Do You Calculate Market Size
Market sizing is crucial for business strategy. Learn to calculate TAM, SAM, and SOM for business planning.
How the How Do You Calculate Market Size works
Master top-down and bottom-up market sizing. Calculate total addressable market, serviceable segments, and realistic share for business plans and investor pitches.
Investors demand market size analysis. This calculator teaches professional techniques for credible market opportunity assessment.
How it works
Tutorial
Investors immediately ask “How big is the market?” because even brilliant execution in a tiny market produces mediocre returns. A company capturing 50% of a $20M market is worth far less than one capturing 5% of a $5B market. Market sizing separates fundable opportunities from lifestyle businesses and helps founders understand if their ambition matches reality. Most founders wildly overestimate their market by confusing Total Addressable Market (TAM), Serviceable Available Market (SAM), and Serviceable Obtainable Market (SOM).
Professional market sizing uses systematic approaches: top-down (industry reports and macro data), bottom-up (customer counts and pricing), and value theory (problem value quantification). Learning these methods prevents embarrassing pitch deck mistakes like claiming a “$500B market” when your realistic opportunity is $50M. Investors pattern-match market sizing methodology—amateur approaches signal inexperience, while rigorous analysis demonstrates strategic thinking and earns credibility.
The Basic Formula
| Approach | Formula | Best For |
|---|---|---|
| Top-Down | TAM = Total Industry Size × Relevant Segment % | Established markets with data |
| Bottom-Up | SAM = Target Customers × Average Revenue per Customer | Validating top-down estimates |
| Value Theory | Market = Customers × Problem Cost × Capture % | New markets, disruption |
| SOM (Realistic) | SOM = SAM × Achievable Market Share % | 5-year revenue target |
Step-by-Step Calculation
Example: SaaS tool for dental practice management in the United States, subscription model, targeting small-to-medium practices
Step 1: Calculate TAM (Top-Down)
| Component | Data Source | Value |
|---|---|---|
| Total Dental Practices (US) | ADA statistics | 201,000 practices |
| Practice Management Software Market | Industry reports | $2.1B annual |
| Average Software Spend per Practice | $2.1B / 201,000 | $10,448/year |
| TAM (Total Market) | All dental practices × spend | $2.1 Billion |
Step 2: Calculate SAM (Bottom-Up)
| Segment Filter | Calculation | Result |
|---|---|---|
| Total Practices | Starting universe | 201,000 |
| Practice Size Filter | 1-5 dentists (70% of practices) | 140,700 |
| Technology Adoption | Use cloud software (65%) | 91,455 |
| Budget Fit | Spend $3K-15K/year (80%) | 73,164 |
| Your Product Price | $299/month subscription | $3,588/year |
| SAM (Serviceable Market) | 73,164 practices × $3,588 | $262.5 Million |
Step 3: Calculate SOM (Realistic Capture)
| Factor | Assumption | Justification |
|---|---|---|
| Serviceable Market | $262.5M / 73,164 practices | From SAM calculation |
| Year 5 Market Share Target | 3% of SAM | 2,195 customers in 5 years |
| Customer Acquisition Rate | 10 customers/month avg growth | Achievable with $500K marketing |
| Churn Rate | 15% annual | Industry standard for SMB SaaS |
| SOM (Year 5 Revenue) | 2,195 customers × $3,588 | $7.9 Million |
| Market Share | $7.9M / $262.5M SAM | 3.0% |
What This Means
Your realistic market opportunity is $262.5M (SAM), not the $2.1B total dental software market (TAM). The TAM includes enterprise practices, hospitals, specialty clinics, and customers who’ll never buy your product—irrelevant to your business. Your SAM focuses on small-to-medium practices with cloud adoption and appropriate budgets. The 5-year SOM target of $7.9M revenue (3% market share) represents an achievable goal that could support a $40-80M valuation at exit.
Presenting these three numbers shows sophistication: “We’re entering a $2.1B market (TAM), specifically targeting the $262M small-practice segment (SAM), with a realistic 5-year goal of $7.9M revenue representing 3% market share (SOM).” This demonstrates you understand the difference between total opportunity and achievable results. If you claimed “$2.1B opportunity” without segmentation, investors would dismiss you as naive. The 3% market share is ambitious but credible—10%+ raises skepticism without extraordinary proof.
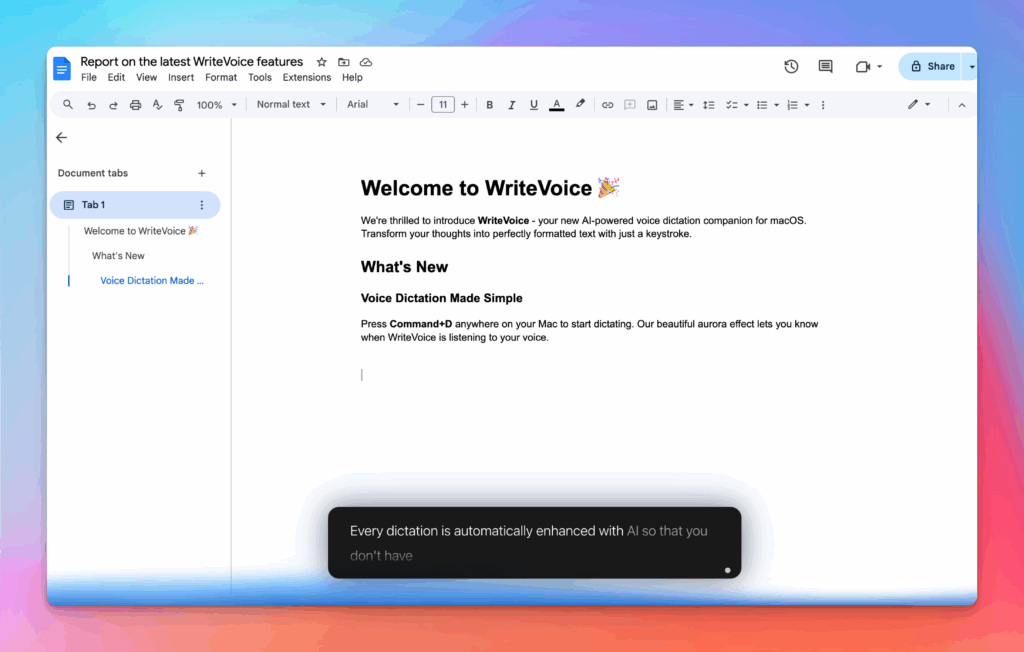
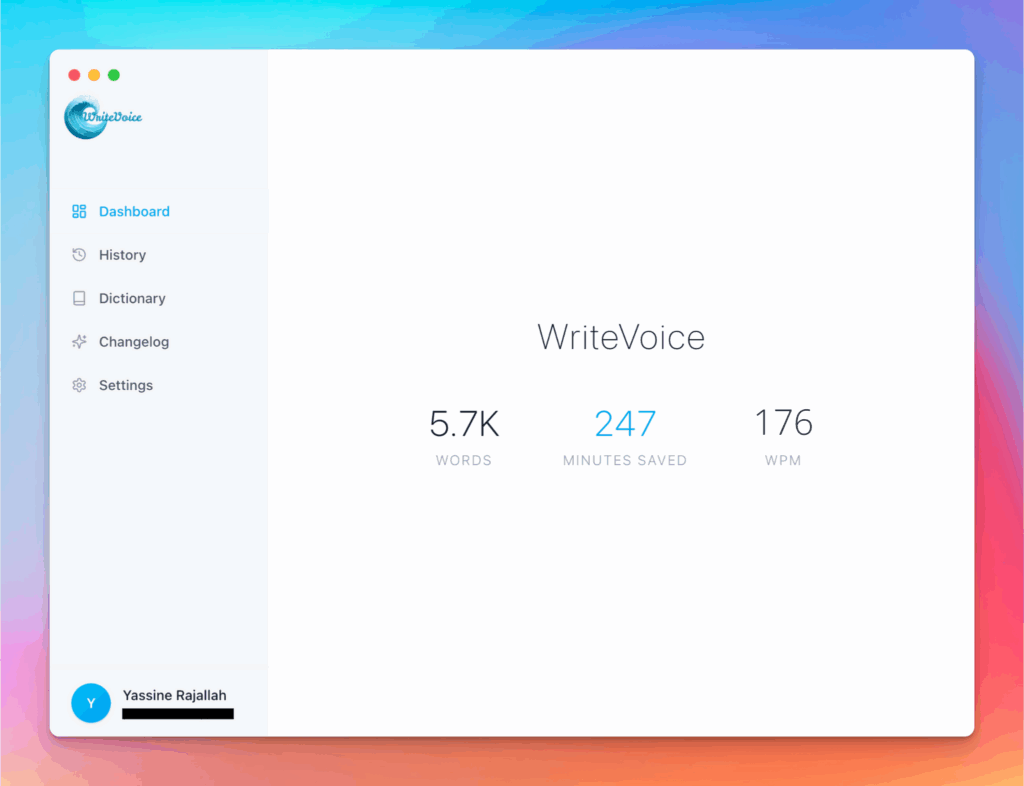
Meet the fastest voice-to-text for professionals
WriteVoice turns your voice into clean, punctuated text that works in any app. Create and ship faster without typing. Your first step was How Do You Calculate Market Size; your next step is instant dictation with WriteVoice.
A blazing-fast voice dictation
Press a hotkey and talk. WriteVoice inserts accurate, formatted text into any app, no context switching

Works in any app
Press one hotkey and speak; your words appear as clean, punctuated text in Slack, Gmail, Docs, Jira, Notion, and VS Code—no context switching, just speed with writevoice
Accurate, multilingual, and smart
97%+ recognition, smart punctuation, and 99+ languages so your ideas land first try, built for teams and pros.
Private by default
Zero retention, audio and text are discarded instantly, with on-device controls so you can dictate sensitive work confidently.